In this article, you will learn about creating Google Sheets pivot table and charts from pivot tables. See how to create a pivot table from multiple sheets in a Google spreadsheet.
This article is intended not only for those who are just starting to use pivot tables in Google Sheets but also for those who want to do it more efficiently.
Further on you will find the answers to the following questions:
What is Google Sheets pivot table?
Do you have so much data that you're getting confused from the amount of information? Are you overwhelmed by numbers and don't understand what's going on?
Let's imagine that you're working in a company that sells chocolate to different buyers from several regions. Your boss told you to determine the best buyer, the best product and the most profitable region of sales.
No reason for panicking, you don't have to start recalling how to use heavy-duty functions like COUNTIF, SUMIF, INDEX, and so on. Take a deep breath. Google Sheets pivot table is a perfect solution for such a task.
A Pivot table can help you in presenting your data in a more convenient and understandable form.
The main handy feature of a pivot table is its ability to move the fields interactively, to filter, group and sort the data, to calculate the sums and the average values. You can switch lines and columns, change detail levels. It enables you not only to modify the appearance of the table but also to take a glance at your data from another angle.
It's also important to note that your basic data is not changing - no matter what you do in your pivot table. You just choose the way it is presented, which allows you to see some new relationships and connections. Your data in the pivot table will be divided into parts, and a huge volume of information will be presented in an understandable form that will make analyzing data a breeze.
How to create a pivot table in Google Sheets?
This is how my sample spreadsheet data for pivot table looks like:
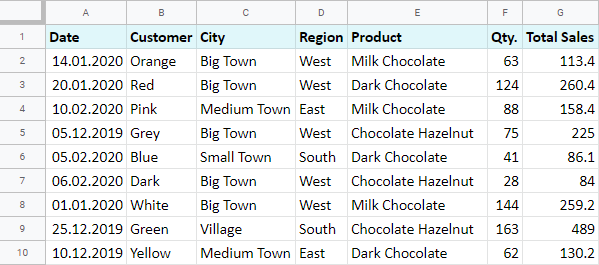
Open the Google sheet that contains your basic data of sales. It's important that the data you will be using is arranged by the columns. Each column is one data set. And each column must have a headline. Furthermore, your source data should not contain any merged cells.
Let's build a pivot table in Google Sheets.
Highlight all the data you want to use for creating a pivot table. In the menu, click Data and then Pivot table:
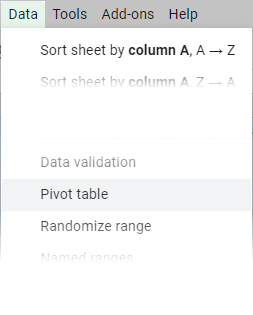
Google spreadsheet will ask if you want to create a pivot table in a new sheet or insert it to any existing one:
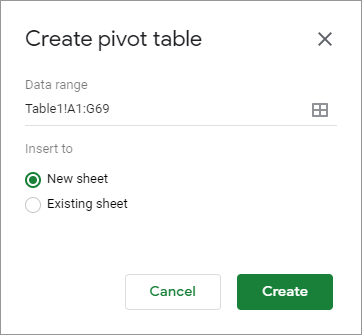
Once you've decided, the only thing left to do is to customize the contents and the appearance of your pivot table.
Open a newly created list with your pivot table. It does not contain any data yet, but you may notice a pane "Pivot table editor" on the right. With its help, you can add fields of "Rows", "Columns", "Values" and "Filter" them:
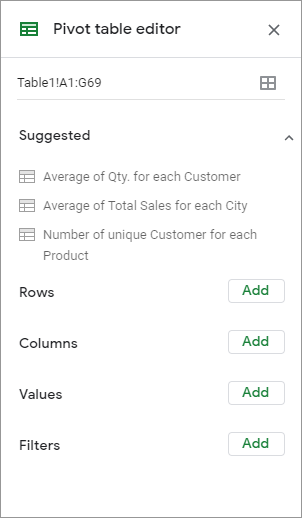
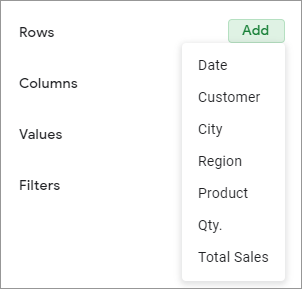
Let's take a look at how to work with a pivot table in Google Sheets. To add a row or a column to your Google Sheets pivot table, simply click "Add" and choose the fields you need for the analysis:
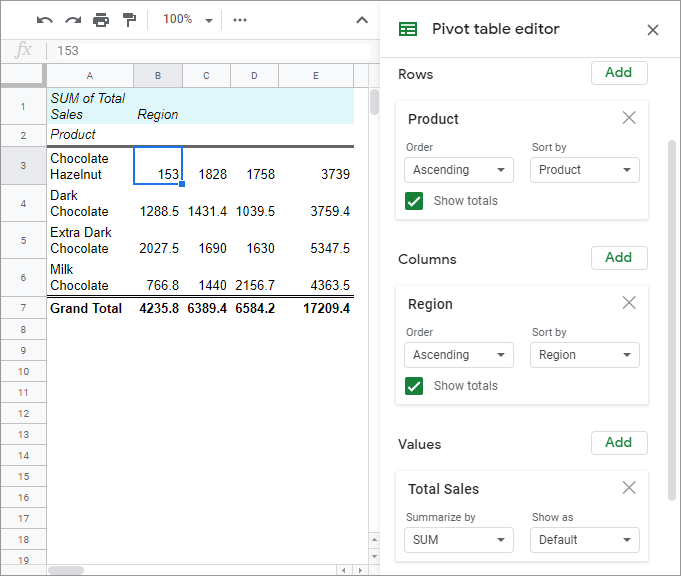
For example, let's calculate the sales of different types of chocolate in different regions:
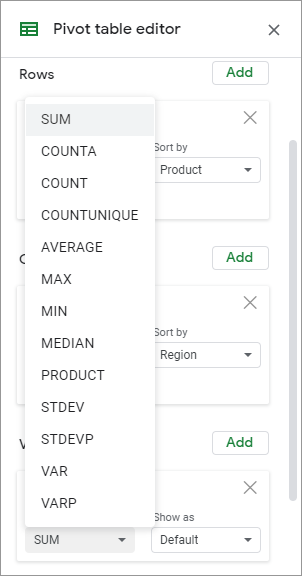
For the "Values" field we can specify how to calculate our totals. They can be returned as a total sum, minimum or maximum sum, average sum, and so on:
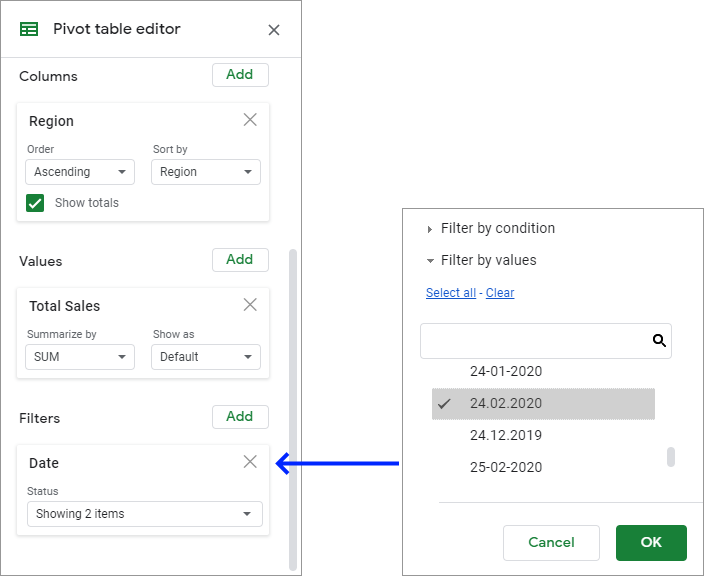
The "Filter" field enables you to estimate the total sales for a certain day:
Google Sheets pivot table has the ability to show even more complex data combinations. To check it out, you just click "Add" and add the data to "Rows" or "Columns".
And so, our pivot table is ready.
How do you use a pivot table in Google spreadsheets?
At the most basic level, pivot tables answer important questions.
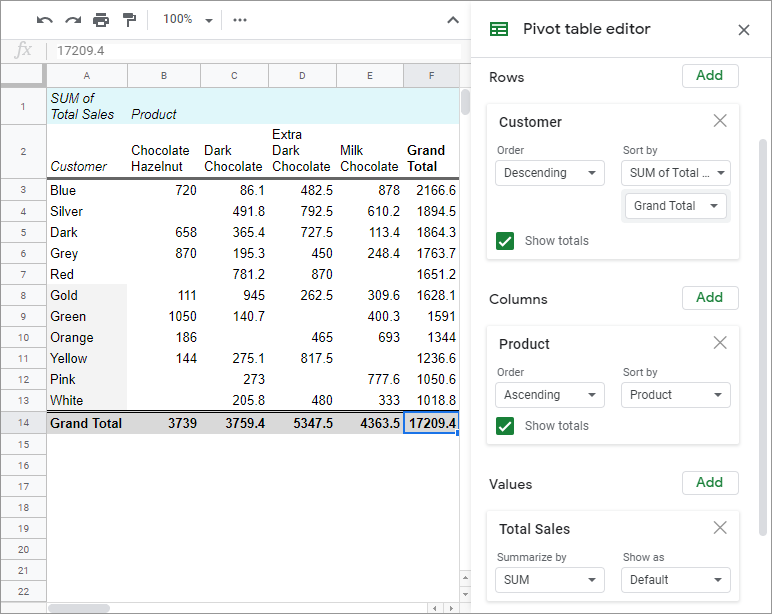
So, let's go back to our boss' questions and look at this pivot table report.
Who are my best customers?
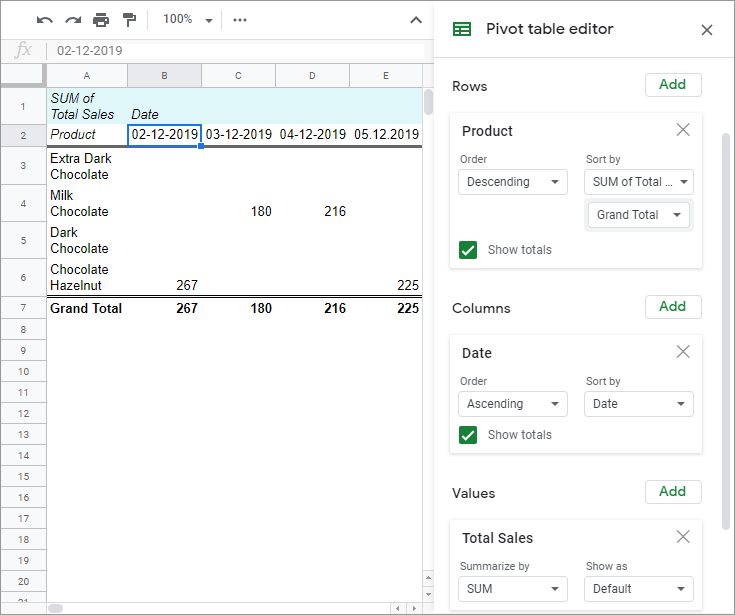
What are my best-selling products?
Where are my sales coming from?

In about 5 minutes, Google Sheets pivot table gave us all the answers that we needed. Your boss is satisfied!
Note. The total volume of sales is the same in all our pivot tables. Each pivot table is representing the same data in different ways.
How to create a chart from pivot table in Google Sheets?
Our data becomes even more visually appealing and clear with pivot table charts. You can add a chart to your pivot table in two ways.
Tip. Learn more about Google Sheets Charts here.
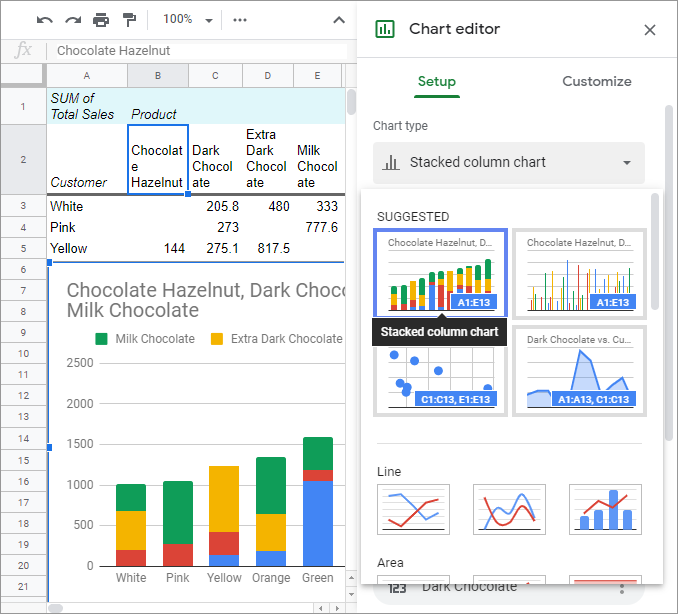
The first way is to click "Insert" in the menu and select "Chart". The Chart editor will instantly appear, offering you to choose the chart type and change its appearance. The corresponding chart will be displayed on the same list with the pivot table:
Another way to create a diagram is to click "Explore" in the right bottom corner of the spreadsheet interface. This option will allow you not only to choose the most well-constructed chart from the recommended ones but also change the appearance of your Google Sheets pivot table:
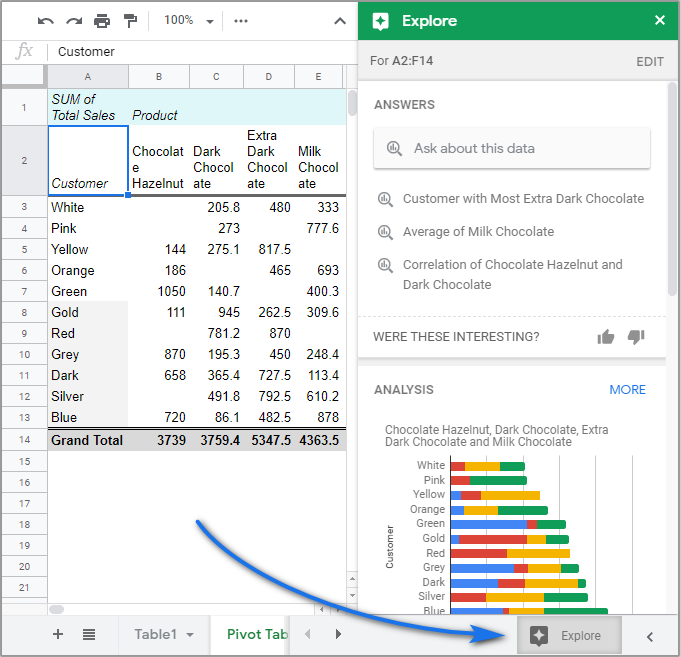
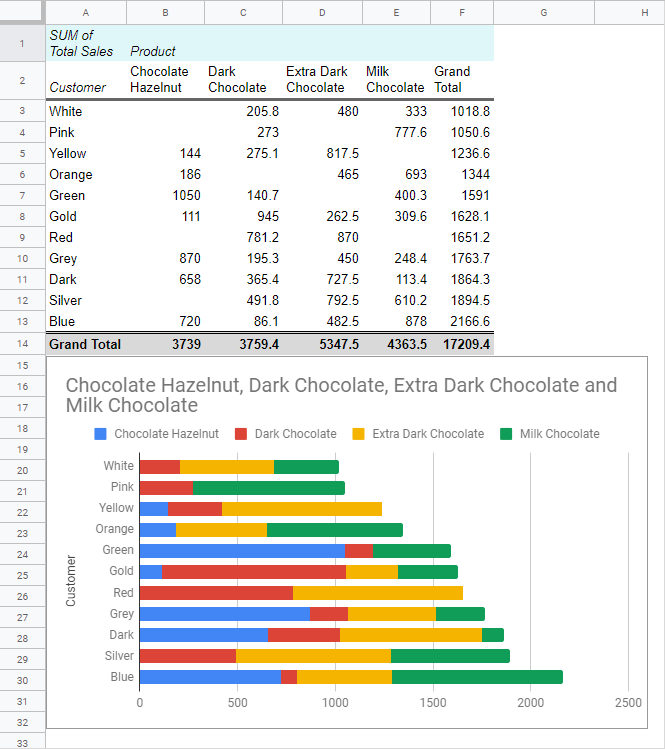
As a result, we have a pivot chart in Google spreadsheet that shows not only the purchase volumes of our customers but also gives us information about the kinds of chocolate the customers prefer:
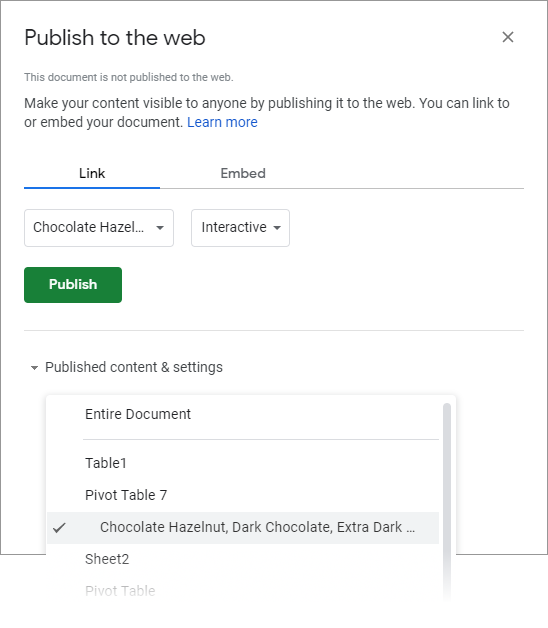
Your diagram can also be published on the Internet. To do this, in the menu click "File" and choose "Publish to the web". Then select the objects you want to post, specify if you want the system to automatically update when the changes are made and press "Publish":
As we can see, pivot tables can make our job easier.
How to make a pivot table from multiple sheets in Google spreadsheet?
It often happens that the data, which is necessary for the analysis, is spread out into different tables. But the Pivot table can be built by using one data span only. You can't use the data from different tables to make a Google Sheets pivot table. So, what's the way out?
If you want to use several different lists in one pivot table, you should combine them in one common table first.
For such a combination, there are several solutions. But taking into account the simplicity and accessibility of pivot tables, we can't help but mention the Merge Sheets add-on, that is of huge help when it comes to combining several data spreadsheets into the one.
We hope that our short review of the abilities of pivot tables has illustrated you the advantages of using them with your own data. Try it yourself, and you'll quickly realize how simple and convenient it is. Pivot tables can help you to save time and increase productivity. Don't forget that the report, which you have made today, can be used tomorrow with the new data.
Note. In contrast to Excel, pivot tables in Google spreadsheets are refreshed automatically. But we advise you to check your refreshed pivot table periodically in order to make sure that the cells it has been created from have not changed.
Have you worked with pivot tables in Google Sheets before? Don't hesitate and share your progress or questions with us below!
 by
by
9 comments
Can you use pivot tables on mobile devices and if you can how?
No, sadly you can work with Pivot tables from your computer only.
Hi, I am used to working with Excel and having charts that I create with Pivot tables being dynamic. however with sheets I find that the charts do not change dynamically based on what data is showing in the pivot table . is this the case? Is there a way of dynamically changing the chart based on variable data? Please tell me this is possible.
Hi Inigo,
I'm afraid charts in Google Sheets can be changed dynamically only with the help of drop-down lists. If you google a bit, you'll find plenty of instructional videos and articles on the topic.
Very helpful! Thanks much!
Cannot really follow and learn without the datafile.
Please provide a copy.
Thanks
Hi Will
You can make a copy of this spreadsheet and try work with existing pivot tables or create new ones.
Feel free to contact us if you have any other questions.
Thanks for this. I'm viewing it on a mobile device and am not seeing any link to the sample sheet you're using. Do you have one? That would better help us appreciate and demonstrate what you're kindly describing here. Even so, I do appreciate the article.
Hello, Charles
Thank you for your feedback.
Here is a link you can use for testing pivot tables in Google sheets. You can make a copy of this spreadsheet and try work with existing pivot tables or create new ones.
If you have any other questions don’t hesitate to contact us. We’ll be happy to help!